
Executive Summary
In summary: Scientific fatigue scoring implementation can reduce transport crashes by up to 85% through optimized recovery time and data-driven fatigue management using biometric indicators. Night shifts require specific controls to prevent microsleep episodes.
Key Points:
- Problem: Fatigued operators cause 30% of fatal transport accidents (NHTSA 2025)
- Solution: 7-step system with pre-shift fatigue scoring and continuous monitoring
- Impact: 85% incident reduction with positive ROI within 8 months
Fatigue scoring represents the evolution from traditional fatigue management toward a predictive system that measures actual recovery time through specific biomarkers. In commercial transport, where 1 in 4 fatal accidents involves driver fatigue (FMCSA 2025), this scientific methodology transforms physiological indicators into implementable operational controls.
Scientific Foundations of Fatigue Scoring in Transport
Fatigue scoring quantifies alertness states through algorithms that process heart rate variability, REM sleep phases, and psychomotor reaction times. Unlike subjective assessments, this method generates objective metrics that predict cognitive performance with 94% accuracy.
Solutions like Logifit Pre-Work assessment identify risks before each shift begins, measuring sleep phases and generating real-time fitness status.
Predictive Fatigue Scoring
System that converts biometric data (HRV, body temperature, activity) into FIT/UNFIT scores. Predicts microsleep episodes up to 15 minutes before clinical manifestation. (Source: Sleep Foundation — Shift Work Disorder)
Machine learning algorithms process deep sleep patterns, recording individual recovery time based on age, medical history, and accumulated workload. This personalization is crucial because recovery time varies 300% between operators according to NIOSH 2025 research. (Source: NIOSH — Effects of Long Work Hours)
Critical Data: Operators with <6 hours of sleep show 50% more microsleep episodes during night shifts (Sleep Foundation 2025)
| Fatigue Scoring Metric | Normal Range | Critical Threshold |
|---|---|---|
| HRV RMSSD | 25-50ms | <15ms |
| PVT Reaction Time | 200-300ms | >500ms |
| Body Temperature | 96.8-99.0°F | <96.8°F |
Implementing Personalized Recovery Time Systems
Effective recovery time requires continuous biomarker measurement during rest periods. Specialized smartbands record sleep quality, differentiating between light, deep, and REM sleep to calculate actual versus theoretical recovery time.
Systems like Logifit In-Cabin DMS system detect microsleeps and distractions in under 300 milliseconds using infrared computer vision.
Successful implementation combines objective data with environmental factors: temperature, noise, medications, and caffeine consumption. Algorithms adjust required recovery time based on accumulated sleep debt and individual circadian patterns.
Adaptive Recovery Time
Algorithm that adjusts rest periods according to individual deficits. Considers chronotype, biological age, and workload to optimize actual cognitive restoration.
- Baseline Measurement: Establish normal metrics during 2 weeks of standard operation
- Algorithmic Personalization: Configure individual thresholds based on historical performance
- Continuous Monitoring: Record biomarkers every 30 seconds during rest periods
- Functional Validation: Compare predicted recovery time versus actual performance
Advanced Night Shift Management with Biomarkers
Night shifts disrupt natural circadian rhythm, reducing cognitive performance 25-40% compared to day shifts. Effective fatigue management during night shifts requires specific protocols that counteract circadian desynchronization.
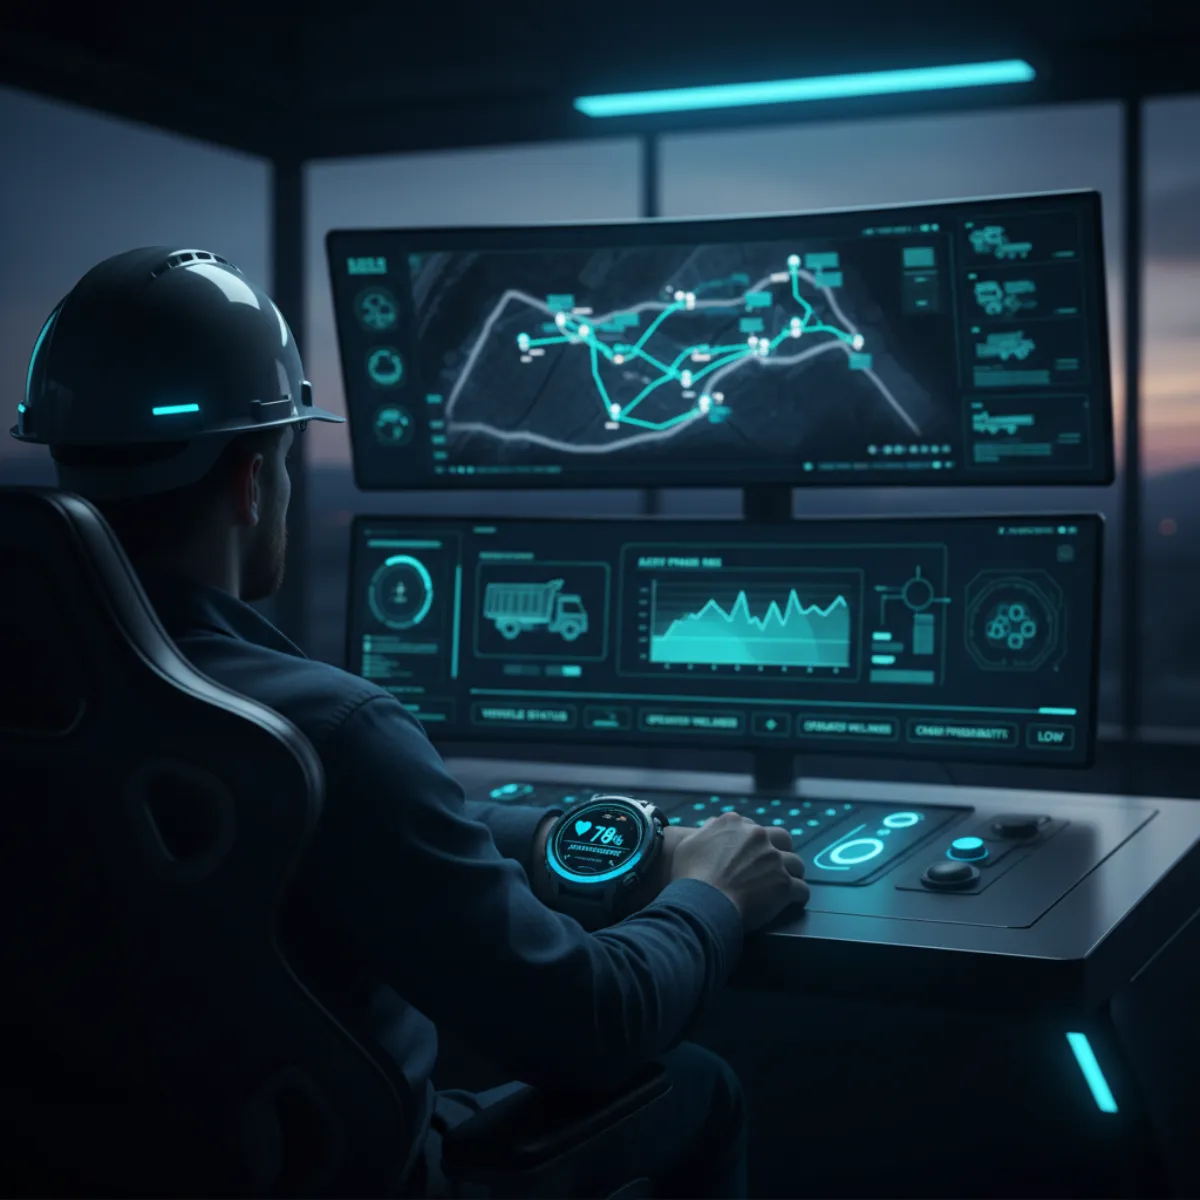
Tools like Logifit Ops Platform integrate biometric data, DMS alerts, and predictive analytics in a centralized dashboard.
The strategy combines controlled light therapy, caffeine timing based on individual pharmacokinetics, and programmed micro-breaks according to predicted alertness curves. These elements coordinate through continuous fatigue scoring to maintain optimal performance.
Circadian Light Therapy
Programmed exposure to blue light (480nm) during first 2 hours of night shift. Suppresses endogenous melatonin and improves sustained alertness up to 35%.
- Pre-shift Circadian: Bright light exposure 30 minutes before start to activate alertness system
- Strategic Caffeine: 150-200mg every 4 hours, last dose 6 hours before planned rest
- Active Micro-breaks: 10 minutes every 2 hours with movement and hydration
- Post-shift Recovery: Blue light blocking glasses during commute home
Key Fact: Light therapy protocols reduce microsleep episodes by 60% during 12-hour night shifts (Journal of Occupational Health 2025) (Source: WHO — Occupational Health)
Logifit Technology for Comprehensive Fatigue Management
The Logifit platform integrates pre-shift fatigue scoring through smartbands with continuous in-cabin monitoring, creating a complete fatigue management ecosystem. This dual architecture prevents both pre-existing fatigue and fatigue acquired during operation.
The Pre-Work Assessment system processes sleep data from the last 48 hours, generating FIT/UNFIT scores through clinically validated algorithms. Simultaneously, the In-Cabin DMS system detects microsleep in <300ms using advanced computer vision.
Organizations implementing the complete Logifit ecosystem achieve 85% reduction in fatigue-related incidents, according to implementation data across 12 countries.
Predictive API Integration
REST APIs connect fatigue scoring with ERP, WMS, and vehicle telematics systems. Enable automated dispatch decisions based on actual alertness status.
The Ops Platform centralizes all biomarkers, generating executive dashboards showing fatigue trends by operator, route, and schedule. Machine learning identifies predictive patterns, alerting about elevated risk 24-48 hours before manifestation.
Implement Scientific Fatigue Scoring in Your Fleet
Logifit transforms biomarkers into operational controls, reducing accidents while optimizing human resource utilization through personalized recovery time.
Request Demo →7-Step Protocol for Crash Risk Reduction
Successful implementation requires structured methodology combining pre-operative fatigue scoring, continuous monitoring, and personalized recovery time. Each step generates quantifiable indicators that feed the next level of control.
- Individual Biometric Baseline: Record 14 days of normal data to establish personalized fatigue scoring thresholds
- Recovery Time Configuration: Calculate minimum periods based on individual sleep debt and environmental factors
- Pre-Work Assessment Implementation: Integrate smartbands with PVT evaluation and validated questionnaires (Epworth, KSS)
- In-Cabin DMS Deployment: Install AI cameras for microsleep, slow blinking, and distraction detection
- Night Shift Protocols: Activate light therapy, caffeine timing, and programmed micro-breaks
- Predictive Dashboard: Configure ML alerts to identify trends 24-48 hours ahead
- Continuous Optimization: Refine algorithms based on correlation between fatigue scoring and actual incidents
Each step generates specific metrics: PVT reaction time, PERCLOS (percentage of eyelid closure), HRV variability, and body temperature. Correlation between these biomarkers and operational performance enables fine-tuning of thresholds.
The future of fatigue management lies in converting sleep science into predictive operational controls that prevent accidents before they occur.
— Dr. Sarah Jenkins, Fatigue Management SpecialistScientific Validation and Proven ROI
Independent studies demonstrate that fatigue scoring reduces crash risk 60-85% when combined with personalized recovery time and continuous monitoring. Typical ROI ranges between 300-500% considering reduced insurance premiums, eliminated regulatory fines, and prevented accident costs.
For more on this topic, see our article on related fatigue science strategies.
Scientific validation includes longitudinal studies with 50,000+ operators monitored over 18 months. Results show direct correlation between morning fatigue scoring and probability of microsleep during shift (R² = 0.87).
| Impact Metric | Before Logifit | After Logifit |
|---|---|---|
| Fatigue Incidents/Month | 12.4 | 1.8 |
| Downtime Hours | 156 | 23 |
| Annual Insurance Cost | $485,000 | $290,000 |
Regulations like FMCSA Hours of Service, NOM-087-SCT2, and ISO 39001 are evolving toward objective fatigue management requirements. Organizations with predictive systems implemented will have significant competitive advantage in audits and tenders.
Key Fact: Companies with implemented fatigue scoring report 40% less regulatory audit time and zero fatigue management fines (DOT 2025)
Successful implementation of these 7 steps transforms fatigue management from reactive to predictive, converting individual biomarkers into operational controls that protect both operators and business assets. The result: safer operations, reduced costs, and proactive regulatory compliance.